The blue bars near the top are the finished annotated sequences for contig 21 and contain 47. Notice the similarity in size for all of the isoforms in comparison to the blast alignments Table 3.1
Each gene and isoform had a percentage sequence identity and sequence similarity to Drosophila melanogaster. Sequence similarity is the percentage of amino acids that are coded in Drosophila elegans that are similar to the amino acids that are coded in Drosophila melanogaster. Sequence identity is the percentage of amino acids that are coded in Drosophila elegans that are the exact same as the amino acids that are coded in Drosophila melanogaster. Tables 3.1 and 3.2 show the sequence similarity and identity for each isoform.
The pictures above are dot plots of each amino acid and show strength of sequence similarity between Drosophila melanogaster’s genes and the submitted annotation of Drosophila elegans. Syt7-PM and Syt7-PA are the exact same sequence; so only one dot plot is needed. Rad23-PA and Rad23-PC are also the exact same sequence. Figures 3.11-3.13 are from contig 21. CG11148-PD and CG11148-PF are the exact same sequence, and CG11148-PH and CG11148-PG are also the exact same sequence so both only need one dot plot.
For CG11148, there were 3 predictions for protein function. 4hpq:C predicts function for CG11148-PD/CG11148-PF. 4h5y and 3fma:A predict function for CG11148-PG/CG11148-PH. The rest of genes’ functions were already known due to prior experimentation on the genes.
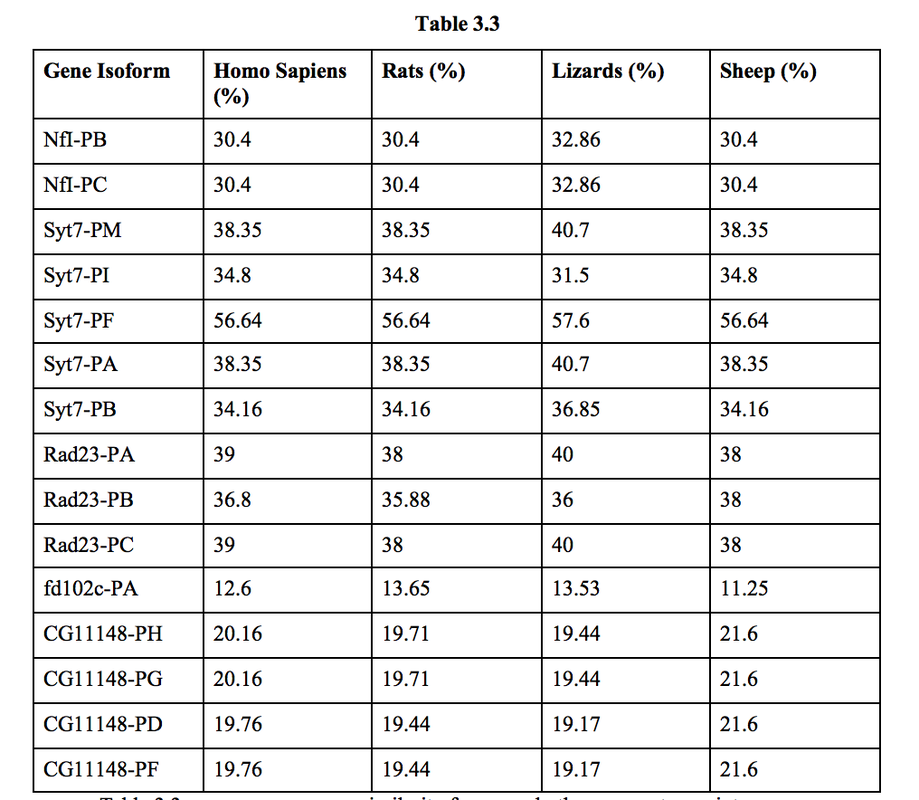
Table 3.3 compares sequence similarity for several other genera to see inter-genus relationships. Sequence similarity was calculated by taking the percentage of identified amino acids and multiplying it by the percentage of the gene that was aligned. This was done in order to determine the total amino acids identified by BLAST.
